

One of the most fundamental concepts a novice forex trader learns is supply and demand zones. Even years after they were first created, prices still respond to these zones because they are so significant. Additionally, a forex trader may not have to bother about drawing each of these historical zones sequentially when using the supply and demand zones indicator.
The MT4 and MT5 Supply and Demand Zones Indicator
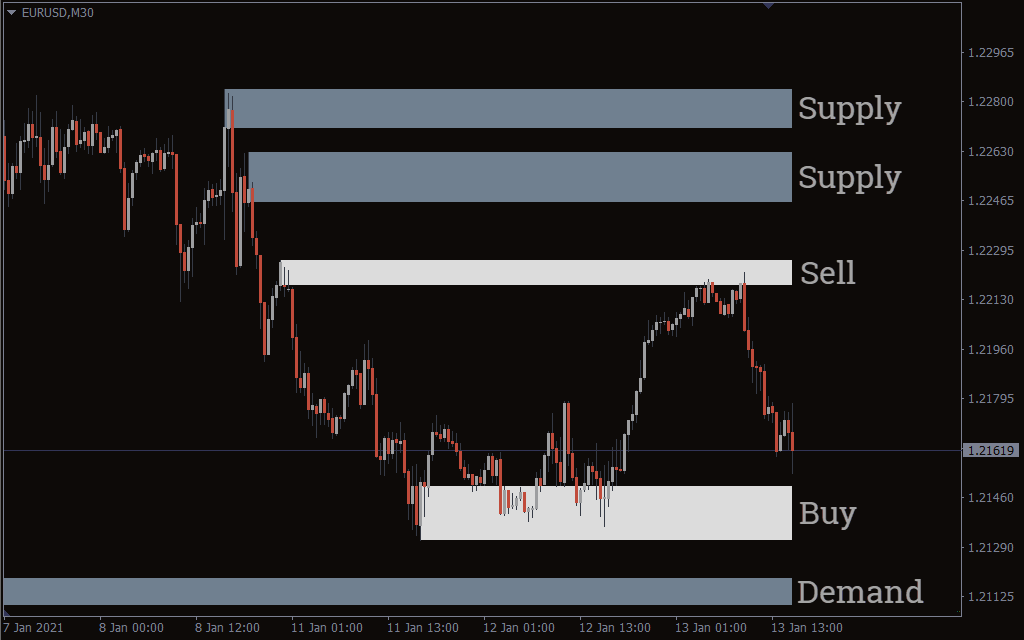
The Supply and Demand Zone Indicator effectively marks the key supply and demand areas for a currency pair on your chart. These zones are displayed in two distinct colors on the MT4 platform: white zones represent areas that have been recently revisited by price, while grey zones indicate untouched areas. Additionally, within the indicator's settings, traders have the option to enable the display of Fibonacci retracement levels between zones.
Download mt5 shved supply & demand indicator
Download mt4 supply & demand zones indicator
Using the Supply and Demand Zone Indicator
This indicator is straightforward to use. Since supply and demand zones function similarly to support and resistance levels, they can be traded in much the same way.
Typically, when the price reaches a supply zone, it tends to reverse downward, while contact with a demand zone often results in an upward bounce. Traders can capitalize on this pattern by entering trades accordingly—selling at supply zones and buying at demand zones.
Important Note on Zones
It's advisable to place more trust in the white-colored zones, as these have been retested by price action, indicating their reliability. These zones have held at least two price interactions, making them more dependable. Grey zones, on the other hand, are yet to be tested and are better used for monitoring potential future setups.
Who Should Use the Supply and Demand Zone Indicator?
This indicator is well-suited for all levels of forex traders. Beginners, in particular, may benefit significantly if they struggle to manually identify support and resistance levels, as this tool simplifies the process.
Experienced traders who rely on their own zone-drawing techniques might not find the indicator perfectly aligned with their methods. Still, the indicator’s high level of precision makes it a potentially valuable addition to any trader’s toolkit, especially for those who use supply and demand in their strategy.
A Quick Recap on Supply and Demand Zones
Structure:
-
Demand Zones: These form when the price surges upward rapidly, showing strong buying interest. When price revisits these areas, buying pressure often reappears.
-
Supply Zones: These are created when the price drops sharply, revealing strong selling momentum. When price returns, sellers may step in again.
Categories:
-
Fresh Zones: Newly formed and not yet tested by price, these zones are often seen as highly reliable due to pending market orders.
-
Tested Zones: These have been interacted with by price. While still useful, their strength may diminish over time.
How They Differ from Traditional Support and Resistance:
-
Supply and Demand Zones: Represent broader areas on the chart, shaped by price volume and market dynamics, making them more relevant for long-term trading.
-
Support and Resistance Levels: Pinpoint specific price levels, typically based on historical touches, and are more useful for short-term trades.
Advantages and Disadvantages
Pros:
-
High Accuracy: Provides better entry and exit signals grounded in actual price behavior.
-
Durability: Zones remain relevant for extended periods, aiding in strategic long-term planning.
Cons:
-
Complexity: Without indicators, identifying these zones manually can be difficult.
-
Unclear Timing: Since zones span a range, it can be harder to pinpoint the exact moment to enter a trade.You’re likely aware that all price movements in the Forex market stem from the ongoing shifts in the balance between buyers and sellers. However, the standard MT5 platform doesn’t come with a built-in tool that highlights areas where significant changes in this balance occur.
That’s why we recommend trying the Shved Supply & Demand indicator — a free tool specifically designed to automatically detect and mark these crucial levels on your chart.
1. Overview of the Shved Supply & Demand Indicator
Supply and demand zones represent price areas where notable trading activity has occurred in the past. These zones are important because when price revisits them, they often provide high-probability entry points for trades.

The indicator identifies and draws these zones based on areas where strong, directional moves have already taken place. The size of each zone reflects the degree of price reaction within that area — the more significant the activity, the larger the zone will appear.
To make things clearer, the indicator adds brief labels to each marked zone, helping traders easily understand their meaning.
As with many Forex indicators, Shved Supply & Demand tends to produce more accurate signals on higher timeframes due to the reduced impact of short-term market noise.
Also, the more times a zone is revisited by price, the more relevant and reliable it tends to become.
2. Types of Zones Displayed by the Shved Supply & Demand Indicator
The indicator identifies and marks five different types of zones:
-
Weak Zone: Areas with minimal supply or demand interest. These are generally low-value for trading, so proceed cautiously or avoid them.
-
Untested Zone: Zones where price previously made a strong move but hasn’t returned since. These are potential areas of interest that haven’t yet been validated.
-
Verified Zone: Areas that have been tested two or more times, indicating renewed trading interest. The indicator also shows the number of retests, with higher counts suggesting stronger zones.
-
Proven Zone: Zones that have been consistently retested. These often trigger price reactions and may even lead to breakouts or trend reversals.
-
Turncoat Zone: Also known as "flip" zones. These start out as support or resistance levels but, once broken, become useful for trading in the opposite direction.
While this indicator is powerful on its own, its effectiveness can be enhanced by combining it with other tools or strategies. For example, pairing it with Price Action, Candlestick Patterns, or other indicators can increase your chances of making successful trades.
Regardless of your trading style, the Shved Supply & Demand indicator is a valuable tool. It highlights areas where price is more likely to react, offering traders a greater opportunity to anticipate market movements and enter profitable positions.
-


0 Comments