

Trend lines are fundamental tools in traditional technical analysis and are widely used by traders because they are simple to draw and highly effective. However, their use can lead to confusion among traders due to factors such as constant redrawing, distinguishing between real and false breakouts, and the abundance of potential lines based on price extremes. As a result, even seasoned traders can struggle to identify valid trend lines. The Auto TrendLine indicator is designed to address and simplify this challenge.
Description Auto TrendLine Indicator
The Auto TrendLine indicator automatically identifies and displays the most relevant trend lines on the chart—those the price is most likely to react to. It uses a mathematical algorithm combined with multiple filters to highlight only the most significant trend lines.
The indicator quickly adapts to market changes. When new price extremes occur, it adjusts the slope of the trend line accordingly. If the trend reverses or shifts to a sideways movement, outdated and irrelevant trend lines are removed from the chart.
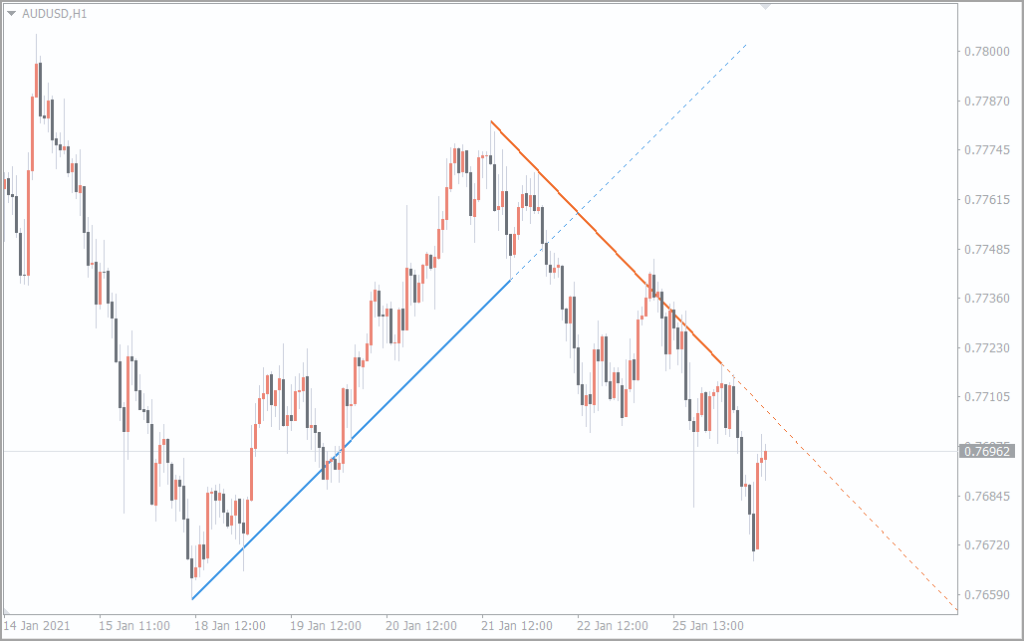
In the real world, the indicator is made up of two lines, each of which is divided into the current trend line (solid) and the projected trend line (dotted):
– blue solid line – uptrend;
– blue dotted line – projected uptrend line;
– red solid line – downtrend;
– red dotted line – projected downtrend line.
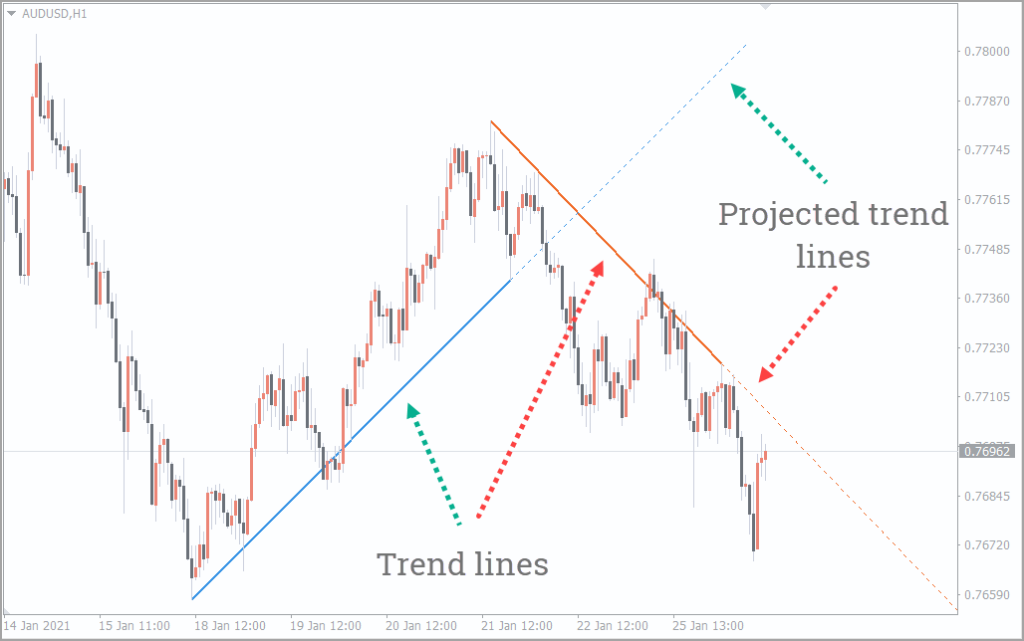
At first site, using two trend lines at once can be confusing for a trader. However, in practice, this will enable you to “read” the chart even better.
If you compare the length of the current uptrend line and that of the current downtrend line, the fact that length and strength of the former is greater becomes very obvious. The red solid line shown in the picture only indicates that there is a small retracement in the market.
Why Do Trend Lines Matter?
The price of a Forex asset is influenced by numerous factors, many of which are difficult to interpret—especially during events like news releases. Such events often lead to increased volatility, potentially causing trend lines to be broken, making market analysis more challenging.
The Auto TrendLine indicator addresses this by accounting for nearly all price movements and adjusting trend lines only in cases of genuine breakouts or actual trend reversals. This approach simplifies chart analysis significantly.
In essence, AutoTrendLines offers a perfect blend of simplicity and effectiveness, making it a valuable tool for both novice and experienced traders to better understand market conditions.
How Can I Trade With the Auto TrendLine Indicator?
It is traditionally considered that trading with the trend is one of the most profitable and safe strategies, since the absolute majority of traders open their positions in one direction in such situations. Using this trend lines indicator will allow you to fully and comprehensively analyze the chart and spot the exact entry points.
 It is also believed that the more signals indicate that you should open a trade, the more reliable the signal will be.
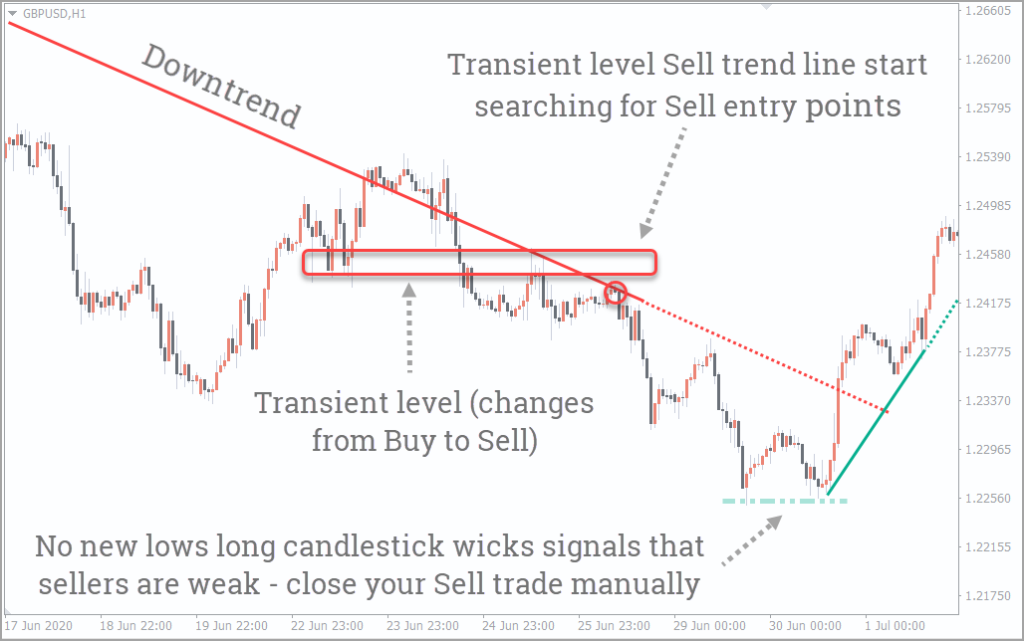
As shown in the example above, the price growth next to the downtrend line has slowed, and an additional signal as the transient level (traders have used the level to buy before, but now they’re selling from it) has finally confirmed the interest in selling. When making a trade, Stop Loss should be set beyond the trend line, and trade should be closed by a pending order (Take Profit) or during the trend change.
Thus, this indicator helped to spot a reliable entry point with the risk-to-profit ratio of 1:3.
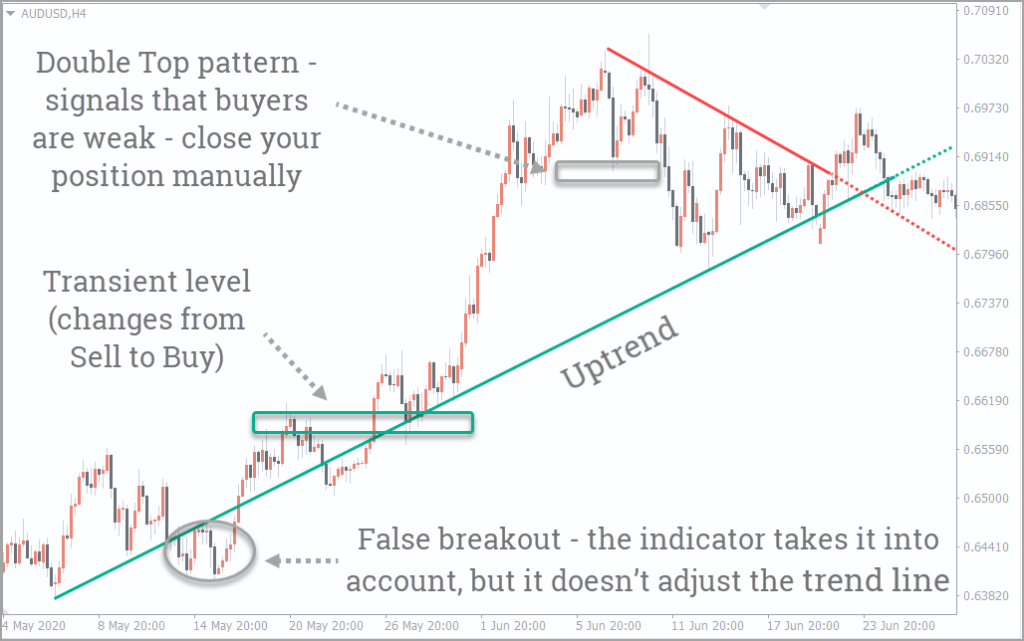
In the opposite scenario—an uptrend—the Auto TrendLine indicator also proves highly effective in chart analysis.
Firstly, as highlighted in the theory, the indicator did not redraw the downtrend line during what appeared to be a false breakout. Without this tool, many traders might have misinterpreted the situation and altered their analysis, potentially leading to incorrect market perspectives and trading decisions.
Secondly, similar to the selling example, the combination of a trend line and a temporary support/resistance level can offer a strong Buy entry point. In this case, the Stop Loss should be placed below the trend line, while the trade can be exited either through a preset Take Profit order or upon receiving a trend reversal signal—such as the appearance of a Double Top pattern.
Just like in the sell scenario, a Buy trade here would typically provide a favorable risk-to-reward ratio of 1:3.
To conclude, this article reviewed the Auto TrendLine indicator. While it serves as a helpful tool, it should be viewed as a complement to your overall trading strategy—not a standalone solution. No indicator should be relied upon entirely.
That said, the Auto TrendLine indicator significantly simplifies the process of identifying meaningful trend lines. Its customizable filters and settings make it accessible and useful for traders at any level of experience.
The indicator has a few settings enough to display the correct trend lines.
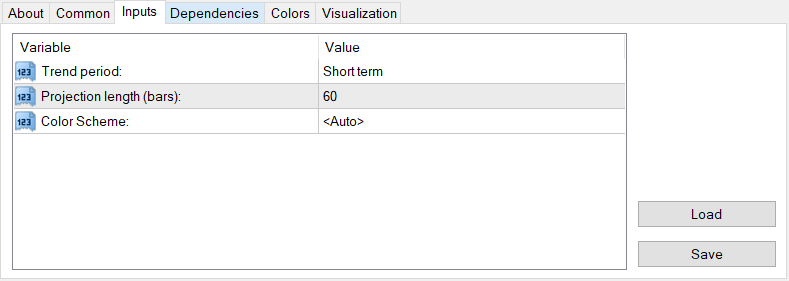
Trend period – selects the period (short-, medium- or long-term), for which trend lines are drawn.
Projection length (bars) – number of bars used to project the trend line
Color Scheme – selects a color scheme.
AUTO AUTO TRENDLINE MT5 DOWNLOAD
AUTO AUTO TRENDLINE MT4 DOWNLOAD


0 Comments