
You’re probably wondering:
“Gosh!”
“There are so many candlestick patterns. How do I remember all of them?”
Well, you don’t have to.
Because if you understand the 3 things I’m about to share with you, then you can read any candlestick patterns like a pro (think of it like a candlestick pattern cheat sheet).
Here’s what you must know…
1. The color of the body tells you who’s in control
2. The length of the wick represents price rejection
3. The ratio of the body to the wick tells you the “whole story”
Let me explain…
1. The color of the body tells you who’s in control

When you see a candle closing above the open, it tells you the buyers are in control
momentarily and that’s why the market closes higher.
And when you see a candle closing below the open, it tells you the sellers are in
control momentarily and that’s why the market closes lower.
Next…

2. The length of the wick represents price rejection

Here’s the thing:
If you get a long upper shadow, it shows you strong rejection of higher prices.
And if you get a long lower shadow, it shows you strong rejection of lower prices.
But what if the shadow (or wick) is short?
Then it means weak rejection of prices.
Makes sense, right?
And finally….
3. The ratio of the body to the wick tells you the “whole story”
Now…
You mustn’t just pay attention to the body (or the shadow) because it’s only one
side of the story.
You must combine both to get the complete picture.
It’s like in a court case where a judge must listen to both the plaintiff and the
defendant before he gives a verdict.
Here are a couple of examples…
Strong bullish close VS weak price rejection:
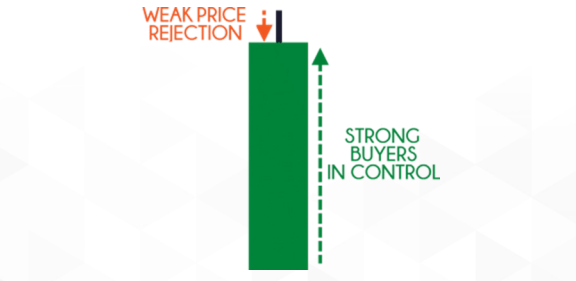
This tells you the buyers are in control as there is minimal selling pressure (the short
upper wick).
Strong price rejection VS weak bullish close:

The sellers are in control as they have reversed most of the earlier gains (long upper
shadow). So, even though it’s a bullish close, the overall picture is bearish
momentarily.
Does it make sense?
Great!
Now you have what it takes to read any candlestick pattern without memorizing a
single one.
Start investing today with chart patterns trading forex


